Dnešní povídání je pokračováním článku Excel – data (nejen) na mapách Google a chci jím poukázat na další velmi zajímavý nástroj – Google – Fusion tables. Jedná se o dynamické tabulky, které umí s pomocí průvodce vykreslovat data na mapě.
Naším zdrojem bude formát CSV. Ačkoliv se Google tváří, že zvládá prakticky libovolné kódování a oddělovač, s českým formátem CSV (hlavně diakritikou) to nedopadlo dobře. Proto jsem si vytvořil zdroj dat v americkém formátu CSV a s kódováním UTF-8 bez BOM (ve VBA a metodě SaveAs použijte Local:=False a následně upravte kódování třeba v Notepad++).
![Google Fusion Tables](https://sp-ao.shortpixel.ai/client/to_webp,q_glossy,ret_img,w_708,h_506/https://proexcel.cz/wp-content/uploads/google-mapy-fusion-tables-01.png)
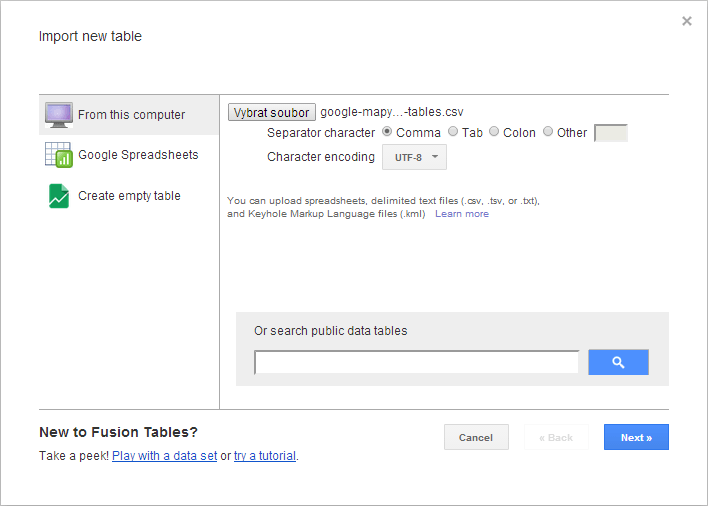
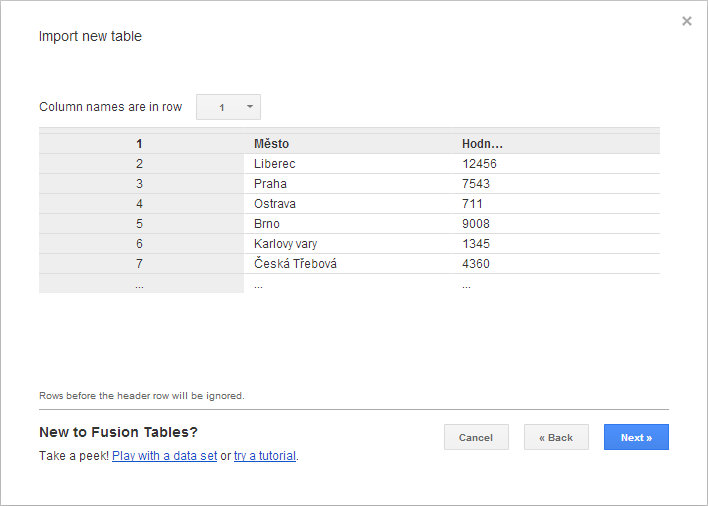
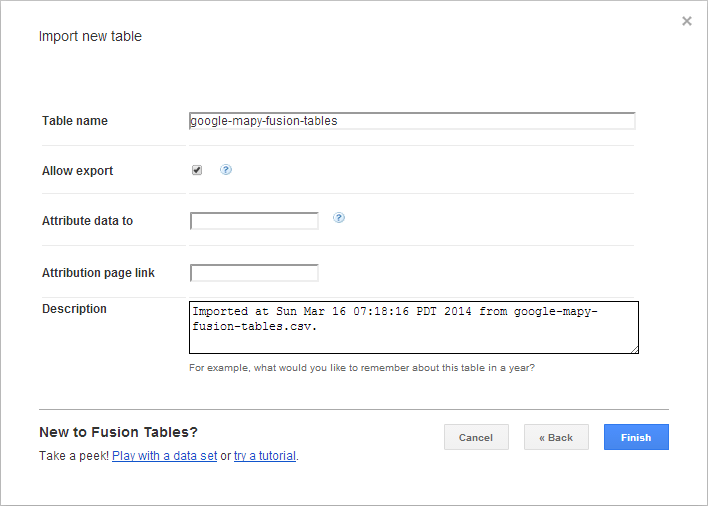
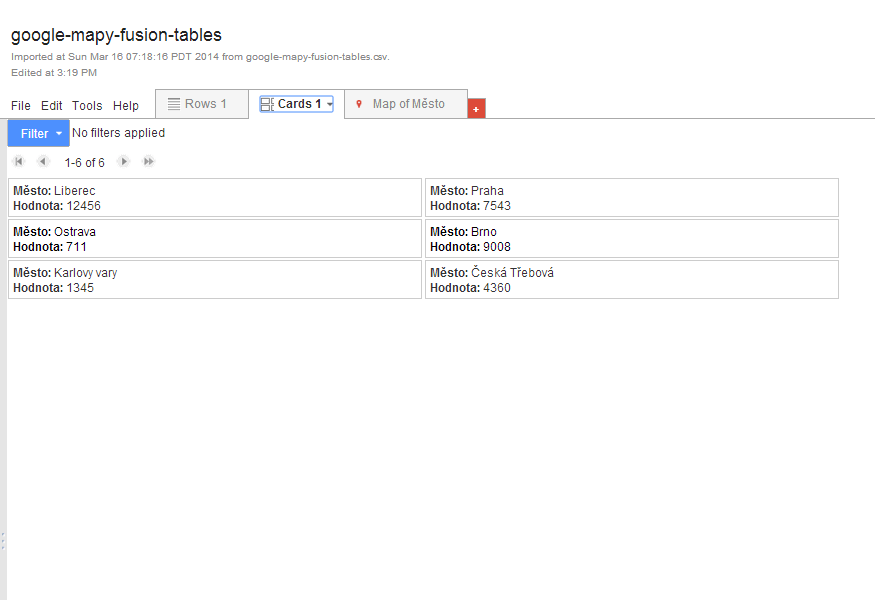
Další postup je tak jednoduchý, že není potřeba ho ani slovně komentovat. Obrazový průvodce bohatě stačí.
![Google Fusion Tables](https://sp-ao.shortpixel.ai/client/to_webp,q_glossy,ret_img,w_708,h_506/https://proexcel.cz/wp-content/uploads/google-mapy-fusion-tables-02.png)
![Google Fusion Tables](https://sp-ao.shortpixel.ai/client/to_webp,q_glossy,ret_img,w_708,h_506/https://proexcel.cz/wp-content/uploads/google-mapy-fusion-tables-03.png)
![Google Fusion Tables](https://sp-ao.shortpixel.ai/client/to_webp,q_glossy,ret_img,w_875,h_600/https://proexcel.cz/wp-content/uploads/google-mapy-fusion-tables-04.png)
![Google Fusion Tables](https://sp-ao.shortpixel.ai/client/to_webp,q_glossy,ret_img,w_875,h_600/https://proexcel.cz/wp-content/uploads/google-mapy-fusion-tables-05.png)
![Google Fusion Tables](https://sp-ao.shortpixel.ai/client/to_webp,q_glossy,ret_img,w_875,h_600/https://proexcel.cz/wp-content/uploads/google-mapy-fusion-tables-06.jpg)
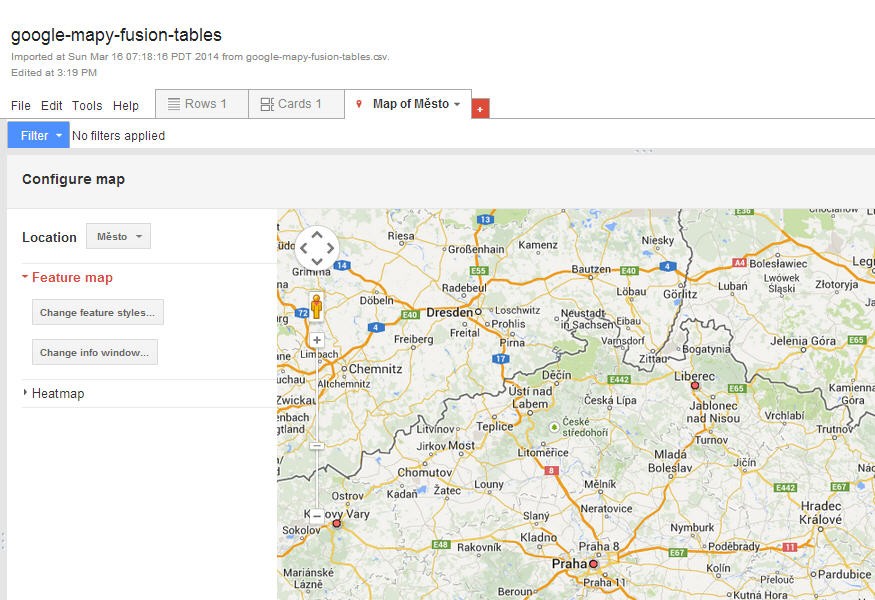
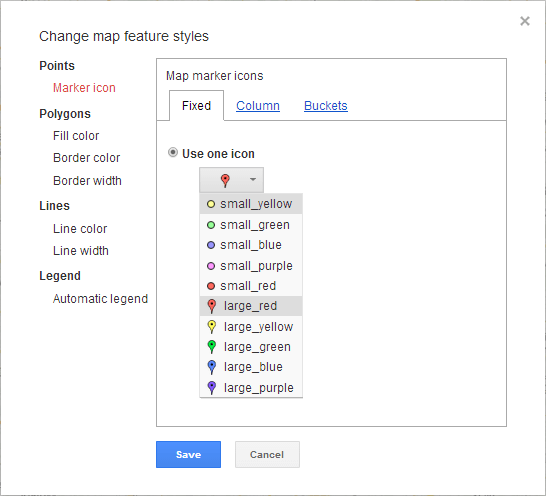
Předdefinované markery nejsou prakticky okem rozeznatelné od ostatních elementů mapy, proto si je upravíme klepnutím na tlačítko Change feature styles.
![Google Fusion Tables](https://sp-ao.shortpixel.ai/client/to_webp,q_glossy,ret_img,w_546,h_496/https://proexcel.cz/wp-content/uploads/google-mapy-fusion-tables-07.png)
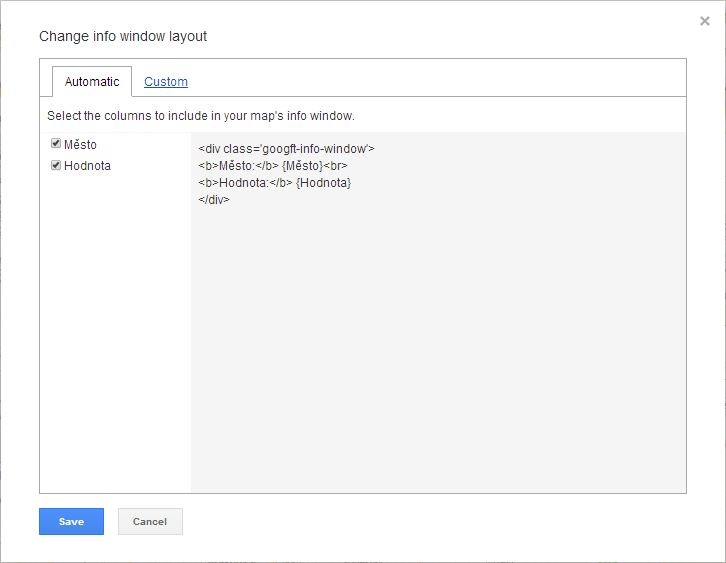
Stejně tak si můžeme nastylovat informační bubliny (tlačítko Change info window).
![Google Fusion Tables](https://sp-ao.shortpixel.ai/client/to_webp,q_glossy,ret_img,w_726,h_563/https://proexcel.cz/wp-content/uploads/google-mapy-fusion-tables-08.png)
![Google Fusion Tables](https://sp-ao.shortpixel.ai/client/to_webp,q_glossy,ret_img,w_875,h_600/https://proexcel.cz/wp-content/uploads/google-mapy-fusion-tables-09.jpg)
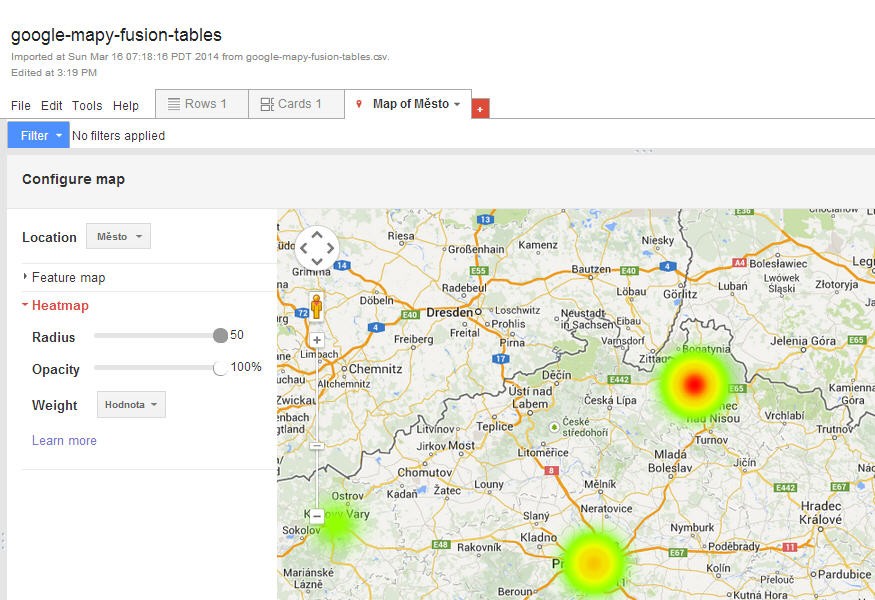
Data můžeme také zobrazovat ve formě jakési teplotní mapy (heatmap)
![Google Fusion Tables](https://sp-ao.shortpixel.ai/client/to_webp,q_glossy,ret_img,w_875,h_600/https://proexcel.cz/wp-content/uploads/google-mapy-fusion-tables-10.jpg)
A stejně jako teď já můžete svůj výtvor nasdílet – odkaz.